بخشی از پاورپوینت
--- پاورپوینت شامل تصاویر میباشد ----
اسلاید 1 :
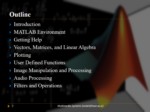
Introduction
MATLAB Environment
Getting Help
Vectors, Matrices, and Linear Algebra
Plotting
User Defined Functions
Image Manipulation and Processing
Audio Processing
Filters and Operations
اسلاید 2 :
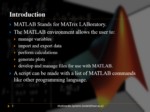
MATLAB Stands for MATrix LABoratory.
The MATLAB environment allows the user to:
manage variables
import and export data
perform calculations
generate plots
develop and manage files for use with MATLAB.
A script can be made with a list of MATLAB commands like other programming language.
اسلاید 3 :
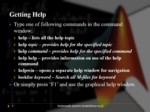
Type one of following commands in the command window:
help – lists all the help topic
help topic – provides help for the specified topic
help command – provides help for the specified command
help help – provides information on use of the help command
helpwin – opens a separate help window for navigation
lookfor keyword – Search all M-files for keyword
Or simply press ‘F1’ and use the graphical help window.
اسلاید 4 :
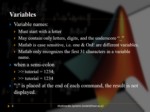
Variable names:
Must start with a letter
May contain only letters, digits, and the underscore “_”
Matlab is case sensitive, i.e. one & OnE are different variables.
Matlab only recognizes the first 31 characters in a variable name.
when a semi-colon
>> tutorial = 1234;
>> tutorial = 1234
”;” is placed at the end of each command, the result is not displayed.
اسلاید 5 :
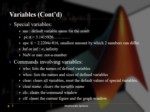
Special variables:
ans : default variable name for the result
pi: π = 3.1415926…………
eps: ∈ = 2.2204e-016, smallest amount by which 2 numbers can differ.
Inf or inf : ∞, infinity
NaN or nan: not-a-number
Commands involving variables:
who: lists the names of defined variables
whos: lists the names and sizes of defined variables
clear: clears all variables, reset the default values of special variables.
clear name: clears the variable name
clc: clears the command window
clf: clears the current figure and the graph window.
اسلاید 6 :
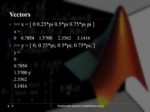
>> x = [ 0 0.25*pi 0.5*pi 0.75*pi pi ]
x =
0 0.7854 1.5708 2.3562 3.1416
>> y = [ 0; 0 25*pi; 0 5*pi; 0 75*pi; ]
y =
0
0.7854
1.5708 y
2.3562
3.1416
اسلاید 7 :
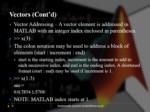
Vector Addressing – A vector element is addressed in MATLAB with an integer index enclosed in parentheses.
>> x(3)
The colon notation may be used to address a block of elements (start : increment : end)
start is the starting index, increment is the amount to add to each successive index, and end is the ending index. A shortened format (start : end) may be used if increment is 1.
>> x(1:3)
ans =
0 0.7854 1.5708
NOTE: MATLAB index starts at 1.
اسلاید 8 :
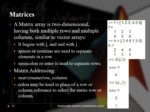
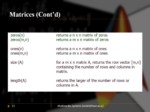
A Matrix array is two-dimensional, having both multiple rows and multiple columns, similar to vector arrays:
It begins with [, and end with ]
spaces or commas are used to separate elements in a row
semicolon or enter is used to separate rows.
Matrix Addressing:
matrixname(row, column)
colon may be used in place of a row or column reference to select the entire row or column.
اسلاید 9 :
Plotting Curves:
plot (x,y) – generates a linear plot of the values of x (horizontal axis) and y (vertical axis).
semilogx (x,y) – generate a plot of the values of x and y using a logarithmic scale for x and a linear scale for y
semilogy (x,y) – generate a plot of the values of x and y using a linear scale for x and a logarithmic scale for y.
loglog(x,y) – generate a plot of the values of x and y using logarithmic scales for both x and y
Multiple Curves:
plot (x, y, w, z) – multiple curves can be plotted on the same graph by using multiple arguments in a plot command. The variables x, y, w, and z are vectors. Two curves will be plotted: y vs. x, and z vs. w.
legend (‘string1’, ‘string2’,…) – used to distinguish between plots on the same graph
Multiple Figures:
figure (n) – used in creation of multiple plot windows. place this command before the plot() command, and the corresponding figure will be labeled as “Figure n”
close – closes the figure n window.
close all – closes all the figure windows.
Subplots:
subplot (m, n, p) – m by n grid of windows, with p specifying the current plot as the pth window
اسلاید 10 :
A M-file is a group of MATLAB commands.
MATLAB can open and execute the commands exactly as if they were entered at the MATLAB command window.
To run the M-files, just type the file name in the command window. (make sure the current working directory is set correctly)