
بخشی از پاورپوینت
--- پاورپوینت شامل تصاویر میباشد ----
اسلاید 1 :
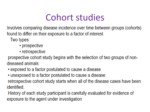
Involves comparing disease incidence over time between groups (cohorts) found to differ on their exposure to a factor of interest.
Two types:
• prospective
• retrospective
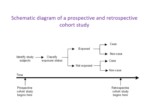
prospective cohort study begins with the selection of two groups of non-diseased animals:
• exposed to a factor postulated to cause a disease
• unexposed to a factor postulated to cause a disease
retrospective cohort study starts when all of the disease cases have been identified.
History of each study participant is carefully evaluated for evidence of exposure to the agent under investigation
اسلاید 2 :
• You can examine multiple outcomes for a single exposure,
• Are very useful in examining rare exposures
• Provide estimates of the absolute incidence of disease in exposed and non-exposed individuals,
• Temporal sequence is logical
Exposure status is recorded before disease has been identified
• Provides unambiguous information about whether exposure preceded disease.
• Well-suited for studying rare exposures.
• Relative number of exposed and non-exposed persons in the study need not necessarily reflect true exposure prevalence in the population at large. Subjects are monitored over time for disease occurrence,
اسلاید 3 :
• Prospective cohort studies require a long follow-up period. Framingham study, 5,000 residents of framingham, massachusetts, since the early 1950’s to establish the rates and risk factors for heart disease
• in the case of rare diseases large groups are necessary.
• because of following forward in time likely of logistical problems,
• Losses to follow-up can become an important problem.
• Often quite expensive to run.
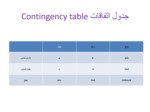
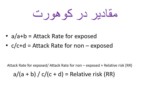
اسلاید 4 :
- a/a+b = Attack Rate for exposed
- c/c+d = Attack Rate for non – exposed
Attack Rate for exposed/ Attack Rate for non – exposed = Relative risk (RR)
a/(a + b) / c/(c + d) = Relative risk (RR)
اسلاید 5 :
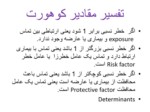
- اگر خطر نسبی برابر 1 شود یعنی ارتباطی بین تماس exposure و بیماری یا عارضه وجود ندارد.
- اگر خطر نسبی بزرگتر از 1 باشد یعنی تماس با بیماری ارتباط دارد و تماس یک عامل خطرزا یا عامل خطر Risk factor است.
- اگر خطر نسبی کوچکتر از 1 باشد یعنی تماس باعث محافظت از بیماری یا عارضه است یعنی تماس یک عامل محافظت Protective factor است.
- Determinants
اسلاید 6 :
- Strength of association – the relationship must be clear,
- Consistency – observation of the association must be repeatable in different populations at different times.
- Temporality – the cause must precede the effect.
- plausiblity – the explanation must make sense biologically.
- Biological gradient – there must be a dose – response relationship.
اسلاید 7 :
Of 80 persons who attended the supper, 75 were interviewed.
Forty-six persons met the case
definition.
Attack rates for those who did and did not eat each of 14 items are presented in the table.
اسلاید 8 :
- آنها که در آب خورده بودند.
- آنها که در غذا خورده بودند.
- آنها که نخورده بودند.
اسلاید 9 :
- first step assume that the exposure is not related to disease , known as the null hypothesis.
- if the null hypothesis proves to be implausible, alternative hypothesis,
- compute a measure of association, such as a relative risk or odds ratio.
- calculate a chi-square or other statistical test.
- Consider p-value or probability.
- A very small p-value: very unlikely to observe such an association if the null hypothesis is true.
- p-value smaller than some cutoff, such as 5%,accept alternative hypothesis
اسلاید 10 :
Once you have a value for chi-square, you look up its corresponding p-value in a table of chi-squares, such as Table 6.6. Since a two-by-two table has 1 degree of freedom, a chi-square
larger than 3.84 corresponds to a p-value smaller than 0.05. This means that if you have planned to reject the null hypothesis when the p-value is less than 0.05, you can do so if your value for chi-square is greater than 3.84.