


بخشی از پاورپوینت
--- پاورپوینت شامل تصاویر میباشد ----
اسلاید 1 :
Forecasting Winter Precipitation is a Two-Step Process
- First, the current dynamic and thermodynamic forcings of the storm must be assessed.
–Numerical model forecasts must be studied, especially the model quantitative precipitation forecast (QPF).
- Second, the evolution of the hydrometeors from their origin to the surface must be predicted.
–This evolution will be determined by the vertical profile of temperature and moisture.
–This profile will elucidate the type of precipitation- rain, snow, freezing rain, ice pellets, or any combination.
–If the precipitation is expected to fall as snow, a snow to liquid equivalent ratio must be determined to forecast the actual snow amount.
اسلاید 2 :
Why is liquid ratio important to forecasters?
- After forecasting liquid equivalent (QPF), the snow-liquid equivalent ratio must be estimated.
- Significant variations in snow to liquid equivalent ratio can occur even within a single storm system
- A more clear understanding of the processes that act to vary snow density will enable the forecaster to employ a more scientific process oriented method toward forecasting snowfall, versus commonly used empirical techniques.
- A challenge exists to determine the extent of interaction between the dynamical forcing and the microphysical processes that determine snow density (i.e., how efficient is the forcing in producing snowfall from a given amount of liquid equivalent?).
- SLR determines the wintertime precipitation efficiency
اسلاید 3 :
NWS “New Snowfall to Estimated Meltwater Conversion Table” (Kyle and Wesley 1996)
- Utilizes surface temperatures to estimate snowfall from liquid equivalent
- Is only marginally effective, as it does not account for geographic location or in-cloud microphysical processes.
اسلاید 4 :
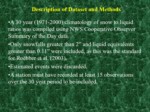
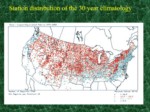
Description of Dataset and Methods
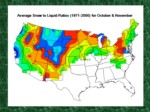
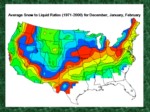
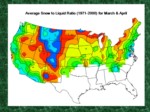
- A 30 year (1971-2000) climatology of snow to liquid ratios was compiled using NWS Cooperative Observer Summary of the Day data.
- Only snowfalls greater than 2” and liquid equivalents greater than 0.11” were included, as this was the standard for Roebber et al. (2003).
- Estimated events were discarded.
- A station must have recorded at least 15 observations over the 30 year period to be included.
اسلاید 5 :
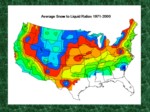
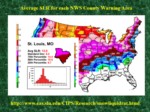
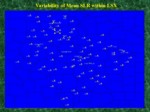
Average SLR for each NWS County Warning Area
اسلاید 6 :
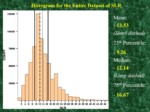
Histogram for the Entire Dataset of SLR
Mean:
- 13.53
(Short dashed)
25th Percentile:
- 9.26
Median:
- 12.14
(Long dashed)
75th Percentile:
- 16.67
اسلاید 7 :
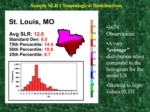
Sample SLR Climatological Distributions
- 3674 Observations
- A very
“average” distribution when compared to the histogram for the entire US - Skewed to high values (0.33)
اسلاید 8 :
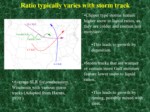
Ratio typically varies with storm track
- Clipper type storms feature higher snow to liquid ratios, as they are colder and contain less moisture.
- This leads to growth by deposition.
- Storm tracks that are warmer or contain more Gulf moisture feature lower snow to liquid ratios.
- This leads to growth by riming, possibly mixed with sleet.
اسلاید 9 :
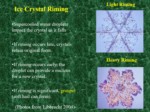
Ice Crystal Riming
- Supercooled water droplets impact the crystal as it falls
- If riming occurs late, crystals retain original form.
- If riming occurs early, the droplet can provide a nucleus for a new crystal.
- If riming is significant, graupel (soft hail can form).
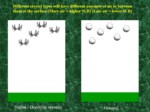
اسلاید 10 :
Different crystal types will have different amounts of air in between them at the surface (More air = higher SLR) (Less air = lower SLR)