بخشی از پاورپوینت
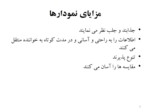
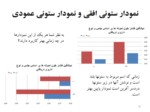
اسلاید 1 :
- جذابند و جلب نظر مي نمايند
- اطلاعات را به راحتي و آساني و در مدت كوتاه به خواننده منتقل مي كنند
- تنوع پذيرند
- مقايسه ها را آسان مي كنند
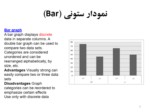
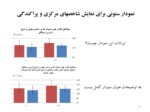
اسلاید 2 :
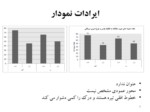
Bar graph
A bar graph displays discrete data in separate columns. A double bar graph can be used to compare two data sets. Categories are considered unordered and can be rearranged alphabetically, by size, etc.
Advantages Visually strong can easily compare two or three data sets
Disadvantages Graph categories can be reordered to emphasize certain effects
Use only with discrete data
اسلاید 3 :
Histogram
A histogram displays continuous data in ordered columns. Categories are of continuous measure such as time, inches, temperature, etc.
Advantages Visually strong can compare to normal curve usually vertical axis is a frequency count of items falling into each category
Disadvantages Cannot read exact values because data is grouped into categories
More difficult to compare two data sets
Use only with continuous data
اسلاید 4 :
Scatter plot
A scatter plot displays the relationship between two factors of the experiment. A trend line is used to determine positive, negative, or no correlation.
Advantages Shows a trend in the data relationship retains exact data values and sample size
Shows minimum/maximum and outliers
Disadvantages Hard to visualize results in large data sets
Flat trend line gives inconclusive results
Data on both axes should be continuous
اسلاید 5 :
- از گذاشتن خطوط اضافه در جدول خود داري فرماييد
- از تكرار علائمي مانند % تا حد امكان خودداري فرماييد
- حتماً بالاي جدول عنوان كامل و در زير جدول در صورت نياز توضيحات مبسوطي بنويسيد كه خواننده به صورت دقيق بتواند همه اعداد و نتايج مندرج در جدول را بفهمد.

